The National Sample Survey Office (NSSO), under the Ministry of Statistics and Programme Implementation (MoSPI), held the Data User Conference on the Household Consumption Expenditure Survey (HCES) 2022-23 today at New Delhi. The event gathered distinguished guests and a diverse array of participants to delve into the insights and applications of the survey. This conference aimed to enhance MoSPI’s interaction and engagement with data users and stakeholders, fostering valuable feedback and collaboration.
Approximately 177 participants from various Central Ministries/Departments, international organizations, and academic institutions attended the conference and contributed to the vibrant discussions.Approximately 211 participants also joined through YouTube.
Dr. Bibek Debroy, an eminent economist, was the Chief Guest of the conference. Prof. Rajeeva Laxman Karandikar, Chairman of the National Statistical Commission (NSC), and Dr. Saurabh Garg, Secretary of MoSPI graced the occasion. Esteemed members from NSC, the Steering Committee of the National Sample Survey,the Standing Committee on Statistics (SCoS)and former CSI & Secretary, MoSPI also attended. Representatives from various institutions/international organisation were also present.
Dr. Saurabh Garg in his opening remarks emphasized the conference’s pivotal role in leveraging data for informed policymaking and societal progress. He emphasized the importance of collaboration among diverse stakeholders to harness data-driven policies that foster inclusive growth.
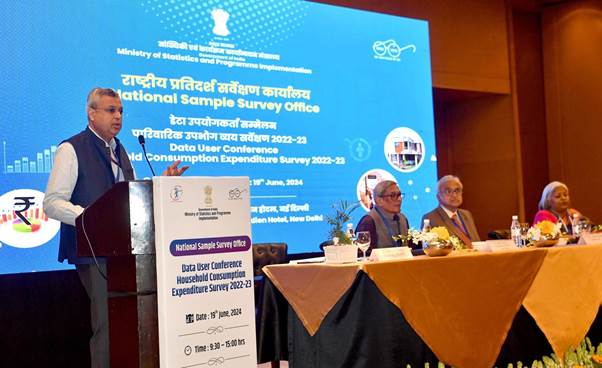
Prof. Rajeeva Laxman Karandikar in his address reflected on the significance of HCES in understanding household consumption patterns and socio-economic dynamics. He advocated for evidence-based decision-making to address poverty, inequality, and sustainable development. He also highlighted the importance of collaboration and knowledge-sharing in amplifying the impact of data-driven efforts. bEmphasizing collaboration among diverse stakeholders, including international organizations and the media, he encouraged active participation to harness data-driven policies that foster inclusive growth and shape a prosperous future for all citizens.
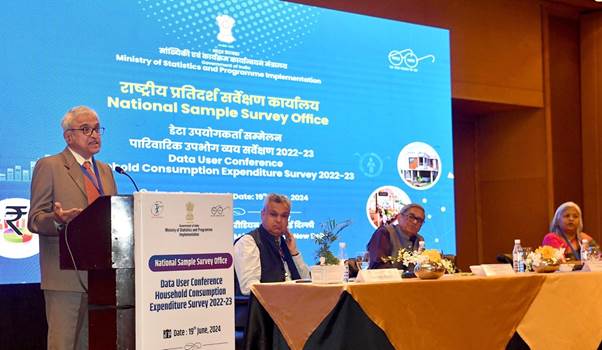
Dr. Bibek Debroy while delivering the Inaugural address emphasized the impact of data in shaping our collective future. He recognized the collaborative efforts in conducting the HCES and highlighted the release of a detailed report on June 7, 2024, providing comprehensive estimates of household consumption expenditure at State and all-India levels. He stressed the importance of leveraging HCES data for targeted interventions and efficient resource allocation.
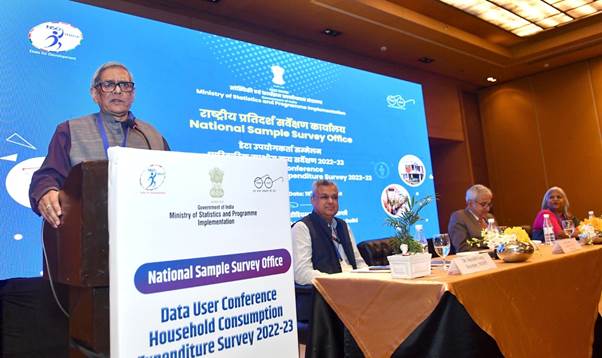
Following the inaugural session, technical sessions focused on various aspects of HCES were organised. The conference featured two insightful technical sessions:
1. Evolution and key findings of HCES, covering objectives, concepts, definitions, sampling design, indicators and key results.
2. The tabular planning and unit-level data intricacies, including understanding unit-level data for tabulation using multipliers and ensuring data quality.
An interactive open discussion and Q&A session co-chaired by Prof. T.C.A Anant & Shri. Pravin Srivastava, former CSI & Secretary, MoSPI provided a collaborative platform for participants to exchange insights and address queries.
The key findings from the Household Consumption Expenditure Survey (HCES: 2022-23) which were presented during the conference are as below:
Key Findings of HCES, 2022-23:
- Estimates of MPCE (without considering imputed values of items received free of cost through various social welfare programmes in HCES, 2022-23)
- Average Monthly Per Capita Consumption Expenditure (MPCE):
The estimated average MPCE for 2022-23 is Rs. 3,773 in rural India and Rs. 6,459 in urban India, up 164% and 146% respectively since 2011-12. Adjusted to 2011-12 prices, the growth is 40% in rural and 33% in urban areas. This rise reflects improved living standards and increased consumer spending, which could boost economic growth through higher demand for goods and services.
- Decline in Urban-Rural gap in average MPCE
The urban-rural difference in average MPCE has decreased from 84% in 2011-12 to 71% in 2022-23 at current prices, and from 84% to 75% at 2011-12 prices. This shrinking gap suggests economic improvements in rural areas and more balanced growth, likely due to effective rural development and better infrastructure.
Table 1 provides the average MPCE values for 2011-12 and 2022-23 at both current and 2011-12 prices.
|
Table 1: Average MPCE (Rs.) in 2011-12 and 2022-23, All-India |
||||||
|
Sector |
Current Prices |
2011-12 prices |
||||
|
2011-12 |
2022-23 |
%change |
2011-12 |
2022-23 |
%change |
|
|
Rural |
1,430 |
3,773 |
163.85 |
1,430 |
2,008 |
40.42 |
|
Urban |
2,630 |
6,459 |
145.59 |
2,630 |
3,510 |
33.46 |
|
Urban-Rural Difference (%) |
83.92 |
71.19 |
– |
83.92 |
74.80 |
– |
- Share of Food and Non-Food items in total MPCE: Decline in the share of food and cereals consumption in total MPCE
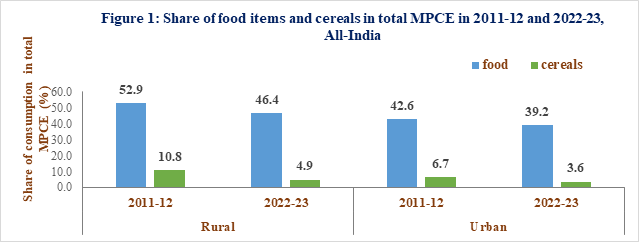
The share of food items in total MPCE has declined from 2011-12 to 2022-23. In rural India, food expenditure dropped from 53% to 46%, and in urban India, it decreased from 43% to 39%. Additionally, per capita expenditure on cereals has also declined.
Figure 1 shows the shares of food items and cereals in total MPCE for 2011-12 and 2022-23.
- Decline in per capita quantity consumption of cereals
Figure 2 shows the monthly per capita consumption of cereals for 2011-12 and 2022-23.

- Contribution of some food and non-food items in average MPCE in 2022-23:
In the rural sector, the top food expenditures are on beverages, refreshments, and processed food (9.62%), followed by milk and milk products (8.33%) and vegetables (5.38%). For non-food items, conveyance leads (7.55%), followed by medical expenses (7.13%), durable goods (6.89%), and fuel and light (6.66%).
In the urban sector, beverages, refreshments, and processed food top the food expenditures (10.64%), followed by milk and milk products (7.22%), and fruits and vegetables (3.8% each). For non-food items, the conveyance is highest (8.59%), followed by durable goods (7.17%), miscellaneous goods & entertainment, and rent (6.56% each).
- Rise in the share of consumption of some items from the level of 2011-12:
The shares of consumption for ‘milk and milk products’, ‘fruits’, ‘egg, fish, and meat’, ‘beverages and processed food’, ‘toilet articles and household consumables’, ‘conveyance’, and ‘durable goods’ have increased in both rural and urban sectors from 2011-12 to 2022-23. In urban areas, the share for ‘egg, fish, and meat’ has remained stable. Table 2 shows these shares for 2011-12 and 2022-23.
|
Table 2: Percentage share of selected item groups in total MPCE in 2011-12 and 2022-23, All-India |
||||
|
Item groups |
Rural |
Urban |
||
|
2011-12 |
2022-23 |
2011-12 |
2022-23 |
|
|
milk and milk products |
8.04 |
8.33 |
7.01 |
7.22 |
|
fruits |
2.83 |
3.71 |
3.42 |
3.81 |
|
egg, fish & meat |
4.79 |
4.91 |
3.65 |
3.57 |
|
beverages, processed food, etc. |
7.90 |
9.62 |
8.98 |
10.64 |
|
toilet articles & other household consumables |
4.01 |
5.12 |
3.88 |
4.98 |
|
conveyance |
4.20 |
7.55 |
6.52 |
8.59 |
|
durable goods |
4.85 |
6.89 |
5.60 |
7.17 |
- Reduction in inequality in the distribution on consumption expenditure:
The Gini coefficient from HCES: 2022-23 shows a decline in consumption expenditure inequality compared to 2011-12 in both sectors. This reduction may result from improved access to basic necessities like food, healthcare, and education. Table 3 provides the Gini coefficient values for both years.
|
Table 3: Gini coefficient of total consumption expenditure in 2011-12 and 2022-23, All-India |
||
|
Sector |
Gini coefficient of consumption expenditure |
|
|
2011-12 |
2022-23 |
|
|
Rural |
0.283 |
0.266 |
|
Urban |
0.363 |
0.314 |
As indicated by the Gini coefficient, reducing income inequality can boost monthly per capita consumption by increasing purchasing power, stimulating economic growth, fostering social cohesion, enhancing human capital, and reducing poverty.
- Estimates of MPCE (considering imputed values of items received free of cost through various social welfare programmes in HCES:2022-23[1])
- Average Monthly Per Capita Consumption Expenditure (MPCE):
The estimated average MPCE in 2022-23, including imputed values from social welfare programs, is Rs. 3,860 in rural and Rs. 6,521 in urban India, up 170% and 148% from 2011-12. Adjusted to 2011-12 prices, growth is 44% in rural and 35% in urban areas. Including free items offers a comprehensive view of household consumption and highlights the positive impact of welfare programs on well-being and economic stability.
Information on free food items received under schemes like NFSA, PMGKAY, and other state programs was collected and their value imputed for a 30-day reference period. For non-food items such as laptops, tablets, mobile phones, bicycles, motorcycles, school uniforms, and shoes received through various government programs, the value was also imputed, though specific programs were not identified.
PM-JAY and similar state schemes provide cashless healthcare, with the government covering the full premium. Beneficiaries are unaware of service costs, making it complex to impute these expenses. As a result, in HCES costs for free healthcare and education services is not imputed.Table 4 provides average MPCE values, including imputed values, for 2011-12 and 2022-23 at current and 2011-12 prices.
|
Table 4: Average MPCE (imputed) (Rs) in 2011-12 and 2022-23, All-India |
||||||
|
Sector |
Current Prices |
2011-12 prices |
||||
|
2011-12 |
2022-23 |
% growth |
2011-12 |
2022-23 |
% growth |
|
|
Rural |
1,430 |
3,860 |
169.93 |
1,430 |
2,054 |
43.64 |
|
Urban |
2,630 |
6,521 |
147.95 |
2,630 |
3,543 |
34.71 |
|
Urban-Rural Difference (%) |
83.92 |
68.94 |
– |
83.92 |
72.49 |
– |
(b) Share of Food items in total MPCE (imputed):
Including imputed values for items received through social welfare programs, there is a slight increase in the contribution of food items and cereals to total MPCE in both rural and urban India. Figure 3 shows the shares of food items and cereals in total MPCE for 2011-12 and 2022-23.

Smt Geeta Singh Rathore, DG, NSSO and Shri Kishore Kumar, Additional Director General, NSSO, MoSPI, delivered the vote of thanks and Closing Remarks respectively, expressing heartfelt gratitude to all participants for their active engagement. Shri Kishore Kumar acknowledged the tireless efforts of the Survey Coordination Division in organizing the conference. He also extended appreciation to the online audience joining via YouTube.
The conference concluded with a spirit of collaboration and commitment to leveraging data for evidence-based policies and sustainable development, paving the way for a brighter future.
The detailed report and unit-level data for HCES: 2022-23 are available on the Ministry’s website. For further information, please visit the MoSPI website (http://www.mospi.gov.in).
****
MG/MS/SK

