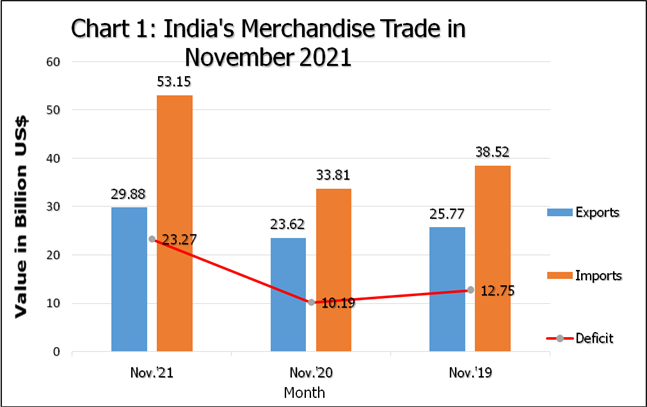
India’s merchandise imports in November 2021 was USD 53.15 billion, an increase of 57.18% over USD 33.81 billion in November 2020 and an increase of 37.96% over USD 38.52billion in November 2019.
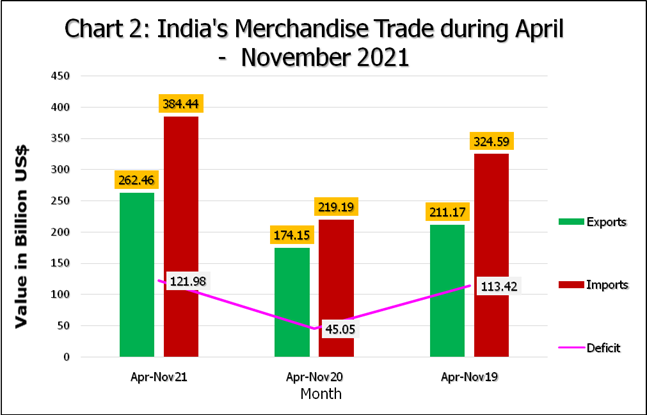
India’s merchandise imports in April-November 2021 was USD 384.44 billion, an increase of 75.39% over USD 219.19 billion in April-November 2020 and an increase of 18.44% over USD 324.59 billion in April-November 2019.
The trade deficit in November 2021 was USD 23.27 billion, while it was121.98 billion USD during April-November 2021.
|
Statement 1: India’s Merchandise Trade in November 2021 |
|||||
|
|
Value in Billion USD |
% Growth |
|||
|
Nov-21 |
Nov-20 |
Nov-19 |
Nov-21 over Nov-20 |
Nov-21 over Nov-19 |
|
|
Exports |
29.88 |
23.62 |
25.77 |
26.49 |
15.93 |
|
Imports |
53.15 |
33.81 |
38.52 |
57.18 |
37.96 |
|
Deficit |
23.27 |
10.19 |
12.75 |
128.30 |
82.48 |
|
Statement 2: India’s Merchandise Trade in Apr-Nov 2021 |
|||||
|
|
Value in Billion USD |
% Growth |
|||
|
|
Apr-Nov21 |
Apr-Nov20 |
Apr-Nov19 |
Apr-Nov 21 over Apr-Nov 20 |
Apr-Nov 21 over Apr-Nov 19 |
|
Exports |
262.46 |
174.15 |
211.17 |
50.71 |
24.29 |
|
Imports |
384.44 |
219.19 |
324.59 |
75.39 |
18.44 |
|
Deficit |
121.98 |
45.05 |
113.42 |
170.80 |
7.54 |
Value of non-petroleum exports in November 2021 was 26.06USD billion, registering a positive growth of 18.1% over non-petroleum exports of USD 22.06 billion in November 2020 and a positive growth of 18.69% over non-petroleum exports of USD 21.95 billion in November 2019.
Value of non-petroleum imports was USD 38.47 billion in November 2021 with a positive growth of 39.9% over non-petroleum imports of USD 27.5 billion in November 2020 and a positive growth of 40.12% over non-petroleum imports of USD 27.45 billion in November 2019.
|
Statement 3: Merchandise Non-POL Trade in November 2021 |
|||||
|
|
Value in Billion USD |
% Growth |
|||
|
|
Nov21 |
Nov20 |
Nov19 |
Nov21 over Nov20 |
Nov21 over Nov19 |
|
Exports |
26.06 |
22.06 |
21.95 |
18.10 |
18.69 |
|
Imports |
38.47 |
27.50 |
27.45 |
39.90 |
40.12 |
The cumulative value of non-petroleum exports in April-November 2021 was USD 225.46 billion, an increase of 41.78% over USD 159.03 billion in April-November 2020 and an increase of 23.44% over USD 182.66 billion in April-November 2019.
The cumulative value of non-petroleum imports in April-November 2021 was USD 282.36 billion, showing an increase of 61.4% compared to non-oil imports of USD 174.94 billion in April-November 2020 and an increase of 18.34% compared to non-oil imports of USD 238.6 billion in April-November 2019.
|
Statement 4: Merchandise Non-POL Trade Apr-Nov 2021 |
|||||
|
|
Value in Billion USD |
% Growth |
|||
|
|
Apr-Nov21 |
Apr-Nov20 |
Apr-Nov19 |
Apr-Nov21 over Apr-Nov20 |
Apr-Nov21 over Apr-Nov19 |
|
Exports |
225.46 |
159.03 |
182.66 |
41.78 |
23.44 |
|
Imports |
282.36 |
174.94 |
238.60 |
61.40 |
18.34 |
Value of non-petroleum and non-gems and jewellery exports in November 2021 was USD 23.66 billion, registering a positive growth of 22.16% over non-petroleum and non-gems and jewellery exports of USD 19.37 billion in November 2020 and a positive growth of 22.17% over non-petroleum and non-gems and jewellery exports of USD 19.37 billion in November 2019.
Value of non-oil, non-GJ (gold, silver & Precious metals) imports was USD 32.02 billion in November 2021 with a positive growth of 41.53%over non-oil and non-GJ imports of USD 22.63 billion in November 2020and apositivegrowth of 42.72% over non-oil and non-GJ imports of USD 22.44 billion in November 2019.
|
Statement 5: Merchandise Non-POL Non-GJ Trade in November 2021 |
|||||
|
|
Value in Billion USD |
% Growth |
|||
|
|
Nov-21 |
Nov-20 |
Nov-19 |
Nov21 over Nov20 |
Nov21 over Nov19 |
|
Exports |
23.66 |
19.37 |
19.37 |
22.16 |
22.17 |
|
Imports |
32.02 |
22.63 |
22.44 |
41.53 |
42.72 |
The cumulative value of non-petroleum and non-gems and jewellery exports in April-November 2021 was USD 199.56 billion, an increase of 37.89% over cumulative value of non-petroleum and non-gems and jewellery exports of USD 144.72 billion in April-November 2020 and an increase of 27.03% over cumulative value of non-petroleum and non-gems and jewellery exports of USD 157.09 billion in April-November 2019.
Non-oil, non-GJ (Gold, Silver & Precious Metals) imports was USD 228.09 billion in April-November 2021, recording a positive growth of 49.52%, as compared to non-oil and non-GJ imports of USD 152.55 billion in April-November 2020 and a positive growth of 13.54% over USD 200.89 billion in April-November 2019.
|
Statement 6: Merchandise Non-POL Non-GJ Trade Apr-Nov 2021 |
|||||
|
|
Value in Billion USD |
% Growth |
|||
|
|
Apr-Nov21 |
Apr-Nov20 |
Apr-Nov19 |
Apr-Nov21 over Apr-Nov20 |
Apr-Nov21 over Apr-Nov19 |
|
Exports |
199.56 |
144.72 |
157.09 |
37.89 |
27.03 |
|
Imports |
228.09 |
152.55 |
200.89 |
49.52 |
13.54 |
Top 10 major commodity groups covering 79% of total exports are as follows:
|
Statement 7: Exports of Top 10 Major Commodity Groups |
||||
|
Value of Export (Million US$) |
Share (%) |
Growth (%) |
||
|
Major Commodity Group |
Nov ’21 |
Nov ’20 |
Nov ’21 |
Nov ’21 over Nov ’20 |
|
Engineering Goods |
8077.32 |
5896.67 |
27.04 |
36.98 |
|
Petroleum Products |
3820.03 |
1557.36 |
12.79 |
145.29 |
|
Gems and Jewellery |
2392.20 |
2690.83 |
8.01 |
-11.10 |
|
Organic and Inorganic Chemicals |
2246.50 |
1694.92 |
7.52 |
32.54 |
|
Drugs and Pharmaceuticals |
1825.36 |
1963.40 |
6.11 |
-7.03 |
|
Electronic Goods |
1455.58 |
1121.17 |
4.87 |
29.83 |
|
Cotton Yarn/Fabrics/Made-ups, Handloom Products Etc. |
1227.83 |
872.55 |
4.11 |
40.72 |
|
RMG Of All Textiles |
1072.17 |
1043.75 |
3.59 |
2.72 |
|
Marine Products |
753.99 |
586.64 |
2.52 |
28.53 |
|
Plastic and Linoleum |
724.35 |
507.25 |
2.42 |
42.80 |
|
Total of 10 Major Commodity Groups |
23595.35 |
17934.54 |
78.98 |
31.56 |
|
Rest |
6280.75 |
5685.40 |
21.02 |
10.47 |
|
Total Exports |
29876.11 |
23619.95 |
100.00 |
26.49 |
Top 10 major commodity groups covering 77% of total imports and showing positive growths in November 2021 over corresponding month of previous year are as follows:
|
Statement 8: Imports of Top 10 Major Commodity Groups |
||||
|
Import (Million US$) |
Share (%) |
Growth (%) |
||
|
Major Commodity Group |
Nov.’21 |
Nov.’20 |
Nov.’21 |
Nov.’21 over Nov.’20 |
|
Petroleum, Crude & products |
14677.89 |
6314.81 |
27.62 |
132.44 |
|
Electronic goods |
5743.17 |
4695.06 |
10.81 |
22.32 |
|
Gold |
4221.66 |
3022.59 |
7.94 |
39.67 |
|
Coal, Coke & Briquettes, etc. |
3577.42 |
1517.08 |
6.73 |
135.81 |
|
Machinery, electrical & non-electrical |
3322.01 |
2568.89 |
6.25 |
29.32 |
|
Organic & Inorganic Chemicals |
2521.60 |
1515.51 |
4.74 |
66.39 |
|
Pearls, precious & Semi- precious stones |
1978.67 |
1839.14 |
3.72 |
7.59 |
|
Artificial resins, plastic materials, etc. |
1860.22 |
1156.63 |
3.50 |
60.83 |
|
Vegetable Oil |
1754.90 |
981.38 |
3.30 |
78.82 |
|
Non-ferrous metals |
1522.68 |
1154.69 |
2.87 |
31.87 |
|
Total of 10 Major Commodity Groups |
41180.22 |
24765.78 |
77.49 |
66.28 |
|
Rest |
11965.41 |
9046.51 |
22.51 |
32.27 |
|
Total Imports |
53145.63 |
33812.29 |
100.00 |
57.18 |
***
DJN/MS/PK

