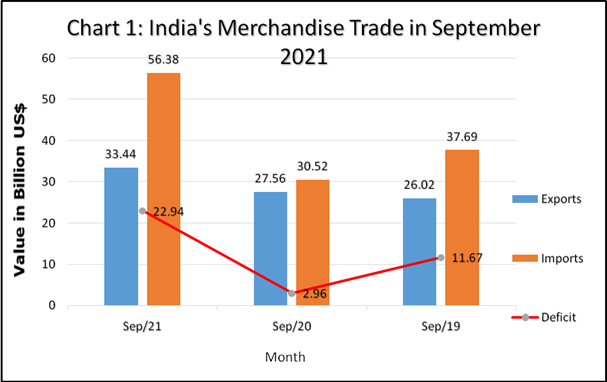
India’s merchandise imports in September 2021 was USD 56.38 billion, an increase of 84.75% over USD 30.52 billion in September 2020 and an increase of 49.58% over USD 37.69 billion in September 2019.
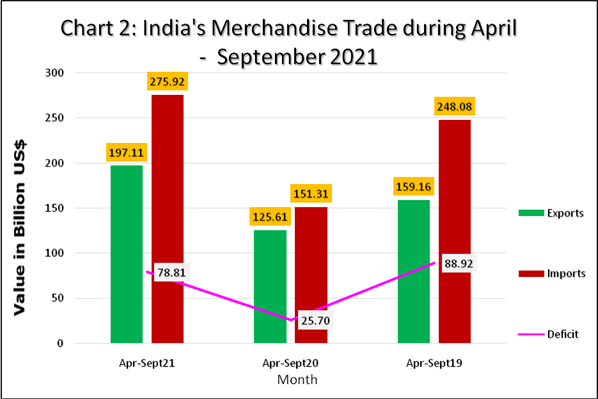
India’s merchandise imports in April-September 2021 was USD 275.92 billion, an increase of 82.36% over USD 151.31 billion in April-September 2020 and an increase of 11.22% over USD 248.08 billion in April-September 2019.
The trade deficit in September 2021 was USD 22.94 billion, while it was USD 78.81 billion during April-September 2021.
|
Statement 1: India’s Merchandise Trade in September 2021 |
|||||
|
|
Value in Billion USD |
% Growth |
|||
|
Sept-21 |
Sept-20 |
Sept-19 |
Sept-21 over Sept-20 |
Sept-21 over Sept-19 |
|
|
Exports |
33.44 |
27.56 |
26.02 |
21.35 |
28.51 |
|
Imports |
56.38 |
30.52 |
37.69 |
84.75 |
49.58 |
|
Deficit |
22.94 |
2.96 |
11.67 |
675.17 |
96.56 |
|
Statement 2: India’s Merchandise Trade in Apr-Sept 2021 |
|||||
|
|
Value in Billion USD |
% Growth |
|||
|
|
Apr-Sept21 |
Apr-Sept20 |
Apr-Sept19 |
Apr-Sept 21 over Apr-Sept 20 |
Apr-Sept 21 over Apr-Sept 19 |
|
Exports |
197.11 |
125.61 |
159.16 |
56.92 |
23.84 |
|
Imports |
275.92 |
151.31 |
248.08 |
82.36 |
11.22 |
|
Deficit |
78.81 |
25.70 |
88.92 |
206.68 |
(-)11.36 |
Value of non-petroleum exports in September 2021 was 28.53USD billion, registering a positive growth of 18.72% over non-petroleum exports of USD 24.03 billion in September 2020 and a positive growth of 26.32% over non-petroleum exports of USD 22.59 billion in September 2019.
Value of non-petroleum imports was USD 38.95 billion in September 2021 with a positive growth of 57.73% over non-petroleum imports of USD 24.69 billion in September 2020 and a positive growth of 36.14% over non-petroleum imports of USD 28.61 billion in September 2019.
|
Statement 3: Merchandise Non-POL Trade in September 2021 |
|||||
|
|
Value in Billion USD |
% Growth |
|||
|
|
Sept21 |
Sept20 |
Sept19 |
Sept21 over Sept20 |
Sept21 over Sept19 |
|
Exports |
28.53 |
24.03 |
22.59 |
18.72 |
26.32 |
|
Imports |
38.95 |
24.69 |
28.61 |
57.73 |
36.14 |
The cumulative value of non-petroleum exports in April-September 2021 was USD 169.13 billion, an increase of 48.87% over USD 113.61 billion in April-September 2020 and an increase of 22.64% over USD 137.91 billion in April-September 2019.
The cumulative value of non-petroleum imports in April-September 2021 was USD 202.95 billion, showing an increase of 70.02% compared to non-oil imports of USD 119.37 billion in April-September 2020 and an increase of 10.97% compared to non-oil imports of USD 182.88 billion in April-September 2019.
|
Statement 4: Merchandise Non-POL Trade Apr-Sept 2021 |
|||||
|
|
Value in Billion USD |
% Growth |
|||
|
|
Apr-Sept21 |
Apr-Sept20 |
Apr-Sept19 |
Apr-Sept21 over Apr-Sept20 |
Apr-Sept21 over Apr-Sept19 |
|
Exports |
169.13 |
113.61 |
137.91 |
48.87 |
22.64 |
|
Imports |
202.95 |
119.37 |
182.88 |
70.02 |
10.97 |
Value of non-petroleum and non-gems and jewellery exports in September 2021 was USD 25.29 billion, registering a positive growth of 18.59% over non-petroleum and non-gems and jewellery exports of USD 21.33 billion in September 2020 and a positive growth of 33.14% over non-petroleum and non-gems and jewellery exports of USD 19.0 billion in September 2019.
Value of non-oil, non-GJ (gold, silver & Precious metals) imports was USD 30.71 billion in September 2021 with a positive growth of 39.61%over non-oil and non-GJ imports of USD 21.99 billion in September 2020and apositivegrowth of 22.9% over non-oil and non-GJ imports of USD 24.98 billion in September 2019.
|
Statement 5: Merchandise Non-POL Non-GJ Trade in September 2021 |
|||||
|
|
Value in Billion USD |
% Growth |
|||
|
|
Sept-21 |
Sept-20 |
Sept-19 |
Sept21 over Sept20 |
Sept21 over Sept19 |
|
Exports |
25.29 |
21.33 |
19.00 |
18.59 |
33.14 |
|
Imports |
30.71 |
21.99 |
24.98 |
39.61 |
22.90 |
The cumulative value of non-petroleum and non-gems and jewellery exports in April-September 2021 was USD 149.84 billion, an increase of 42.82% over cumulative value of non-petroleum and non-gems and jewellery exports of USD 104.92 billion in April-September 2020 and an increase of 26.29% over cumulative value of non-petroleum and non-gems and jewellery exports of USD 118.65 billion in April-September 2019.
Non-oil, non-GJ (Gold, Silver & Precious Metals) imports was USD 163.65 billion in April-September 2021, recording a positive growth of 53.44%, as compared to non-oil and non-GJ imports of USD 106.65 billion in April-September 2020 and a marginal positive growth of 6.51% over USD 153.65 billion in April-September 2019.
|
Statement 6: Merchandise Non-POL Non-GJ Trade Apr-Sept 2021 |
|||||
|
|
Value in Billion USD |
% Growth |
|||
|
|
Apr-Sept21 |
Apr-Sept20 |
Apr-Sept19 |
Apr-Sept21 over Apr-Sept20 |
Apr-Sept21 over Apr-Sept19 |
|
Exports |
149.84 |
104.92 |
118.65 |
42.82 |
26.29 |
|
Imports |
163.65 |
106.65 |
153.65 |
53.44 |
6.51 |
Top 10 major commodity groups, covering more than 80% of total exports, have shown positive growth in September 2021 over corresponding month of previous year, as stated below.
|
Statement 7: Exports of Top 10 Major Commodity Groups |
||||
|
|
Value of Export (Million US$) |
Share (%) |
Growth (%) |
|
|
Major Commodity Group |
Sept ’21 |
Sept ’20 |
Sept ’21 |
Sept ’21 over Sept ’20 |
|
Engineering Goods |
9426.89 |
6896.27 |
28.19 |
36.70 |
|
Petroleum Products |
4913.73 |
3527.01 |
14.69 |
39.32 |
|
Gems And Jewellery |
3235.24 |
2702.57 |
9.67 |
19.71 |
|
Organic And Inorganic Chemicals |
2377.07 |
1833.99 |
7.11 |
29.61 |
|
Drugs And Pharmaceuticals |
2053.35 |
2243.48 |
6.14 |
-8.47 |
|
Cotton Yarn/Fabrics/Made-ups, Handloom Products Etc. |
1308.63 |
932.41 |
3.91 |
40.35 |
|
RMG Of All Textiles |
1300.32 |
1190.38 |
3.89 |
9.24 |
|
Electronic Goods |
1169.65 |
926.20 |
3.50 |
26.28 |
|
Rice |
761.61 |
729.27 |
2.28 |
4.44 |
|
Plastic And Linoleum |
751.20 |
634.19 |
2.25 |
18.45 |
|
Total of 10 Major Commodity Groups |
27297.71 |
21615.78 |
81.62 |
26.29 |
|
Rest |
6145.95 |
5943.27 |
18.38 |
3.41 |
|
Total Exports |
33443.66 |
27559.04 |
100.00 |
21.35 |
Top 10 major commodity groups, covering more than 80% of total imports, have shown below.
|
Statement 8: Imports of Top 10 Major Commodity Groups |
||||
|
|
Import (Million US$) |
Share (%) |
Growth (%) |
|
|
Major Commodity Group |
Sept.’21 |
Sept.’20 |
Sept.’21 |
Sept.’21 over Sept.’20 |
|
Petroleum, Crude & products |
17436.42 |
5826.28 |
30.92 |
199.27 |
|
Electronic goods |
6888.00 |
5873.06 |
12.22 |
17.28 |
|
Gold |
5115.76 |
601.43 |
9.07 |
750.60 |
|
Machinery, electrical & non-electrical |
3198.45 |
2252.34 |
5.67 |
42.01 |
|
Pearls, precious & Semi-precious stones |
2571.63 |
2086.70 |
4.56 |
23.24 |
|
Organic & Inorganic Chemicals |
2485.01 |
1589.39 |
4.41 |
56.35 |
|
Coal, Coke & Briquettes, etc. |
2187.33 |
1195.95 |
3.88 |
82.89 |
|
Vegetable Oil |
1988.93 |
858.18 |
3.53 |
131.76 |
|
Artificial resins, plastic materials, etc. |
1646.11 |
1081.46 |
2.92 |
52.21 |
|
Non-ferrous metals |
1461.24 |
940.70 |
2.59 |
55.34 |
|
Total of 10 Major Commodity Groups |
44978.87 |
22305.50 |
79.77 |
101.65 |
|
Rest |
11404.45 |
8212.85 |
20.23 |
38.86 |
|
Total Imports |
56383.32 |
30518.35 |
100.00 |
84.75 |
***
DJN/PK

