- Production of Crude Oil
Crude oil production[1] during February 2022 was 2272.26 TMT, which is 5.60% lower than target for the month and 2.19% lower than the production of February 2021. Cumulative crude oil production during April-February, 2021-22 was 27162.3 TMT, which is 4.71% and 2.57% lower than target for the period and production during corresponding period of last year respectively. Unit-wise and State-wise crude oil production is given at Annexure-I. Unit-wise crude oil production for the month of February 2022 and cumulatively for April-February 2021-22 vis-à-vis same period of last year has been shown in Table-1 and month-wise in Figure-1.
Table-1: Crude Oil Production (in TMT)
|
Oil Company |
Target |
February (Month) |
April-February (Cumulative) |
||||||
|
2021-22 (Apr-Mar)* |
2021-22 |
2020-21 |
% over last year |
2021-22 |
2020-21 |
% over last year |
|||
|
Target* |
Prod.* |
Prod. |
Target* |
Prod.* |
Prod. |
||||
|
ONGC |
20272.88 |
1555.93 |
1510.52 |
1544.84 |
97.78 |
18544.43 |
17769.62 |
18469.67 |
96.21 |
|
OIL |
3182.60 |
258.61 |
230.25 |
218.49 |
105.38 |
2893.63 |
2729.41 |
2687.75 |
101.55 |
|
PSC Fields |
7718.52 |
592.49 |
531.49 |
559.82 |
94.94 |
7067.77 |
6663.29 |
6722.53 |
99.12 |
|
Total |
31173.99 |
2407.03 |
2272.26 |
2323.15 |
97.81 |
28505.83 |
27162.32 |
27879.95 |
97.43 |
Note: Totals may not tally due to rounding off. *: Provisional
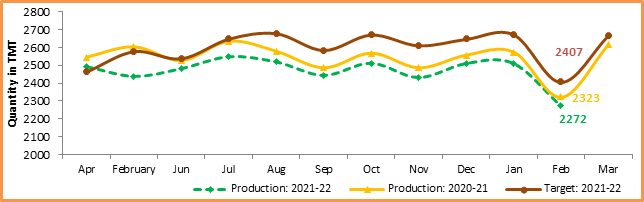
Figure-1: Monthly Crude Oil Production
Unit-wise production details with reasons for shortfall are as under:
-
- Crude oil production by ONGC (Oil and Natural Gas Corporation) in nomination block during February 2022 was 1510.52 TMT, which is 2.92% lower than target of the month and 2.22% lower when compared with production of February 2021. Cumulative crude oil production by ONGC during April-February, 2021-22 was 17769.62 TMT, which is 4.18% and 3.79% lower than target for the period and production during corresponding period of last year respectively. Reasons for shortfall in production are as under:
- Less than anticipated production from WO-16 cluster due to delay in mobilization of MOPU Sagar Samrat.
- Less condensate receipt at Hazira due to less gas production from B&S Asset
-
- Crude oil production by OIL (Oil India Ltd) in the nomination block during February 2022 was 230.25 TMT, which is 5.38% higher when compared with production of February 2021 but 10.97% lower than target of the month. Cumulative crude oil production by OIL during April-February 2021-22 was 2729.41 TMT, which is 1.55% higher than the production during corresponding period of last year but 5.68% lower than target for the period. Reasons for shortfall in production are as under:
- Less than planned contribution from workover wells and drilling wells.
- Less than planned due to local disturbance & miscreants activities in main producing area (MPA).
-
- Crude oil production by Pvt/JVs companies in the PSC/RSC regime during February 2022 was 531.49 TMT, which is 10.29% lower than the target of the reporting month and 5.06% lower than the month production of February 2021. Cumulative crude oil production by Pvt/JVs companies during April-February 2021-22 was 6663.29 TMT, which is 5.72% and 0.88% lower than target for the period and production during corresponding period of last year respectively. Reasons for shortfall in production are as under:
- MB/OSDSF/B80/2016 (Hindustan Oil Exploration Company Ltd.): Delay in commencement of production. Pre-commissioning in progress.
- RAVVA (Cairn Energy India Ltd): Production shortfall due to lower performance of wells RD-3ST and RD-6ST due to infectivity issues.
- CB-ONN-2004/2 (ONGC): Production shortfall due to less evacuation to IOCL due to leakage and choking in ONGC pipeline.
- CB-OS/2 ((Cairn Energy India Ltd): Production shortfall is due to natural decline and increase in water cut observed in aquifer supported pools and recent sanding/loading issues in the wells.
- Production of Natural Gas
Natural gas production during February 2022 was 2602.26 MMSCM, which is 12.79% higher than the production of February 2021 but 16.19% lower than the monthly target. Cumulative natural gas production during April-February 2021-22 was 31137.26 MMSCM, which is 19.82% higher than production during corresponding period of last year but 10.18% lower when compared with target for the period. Unit-wise and state-wise natural gas production is given at Annexure-II. Unit-wise natural gas production for the month of February 2022 and cumulatively for April-February 2021-22 vis-à-vis same period of last year has been shown in Table-2 and month-wise in Figure-2.
Table-2: Natural Gas Production (in MMSCM)
|
Oil Company |
Target |
February (Month) |
April-February (Cumulative) |
||||||
|
2021-22 (Apr-Mar)* |
2021-22 |
2020-21 |
% over last year |
2021-22 |
2020-21 |
% over last year |
|||
|
Target* |
Prod.* |
Prod. |
Target* |
Prod.* |
Prod. |
||||
|
ONGC |
23335.10 |
1820.48 |
1581.80 |
1630.24 |
97.03 |
21309.09 |
18872.98 |
20040.29 |
94.18 |
|
OIL |
2949.65 |
225.86 |
219.30 |
187.88 |
116.72 |
2698.77 |
2642.04 |
2269.66 |
116.41 |
|
PSC Fields |
11834.60 |
1058.76 |
801.17 |
489.04 |
163.82 |
10659.43 |
9622.24 |
3676.86 |
261.70 |
|
Total |
38119.35 |
3105.09 |
2602.26 |
2307.16 |
112.79 |
34667.29 |
31137.26 |
25986.80 |
119.82 |
Note: Totals may not tally due to rounding off. *: Provisional
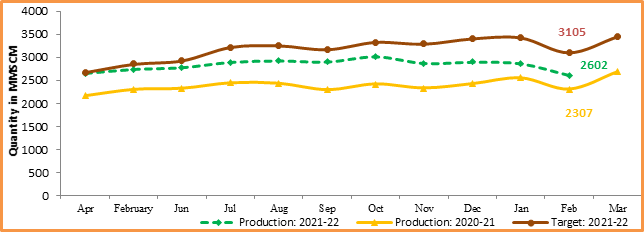
Figure-2: Monthly Natural Gas Production
-
- Natural gas production by ONGC (Oil and Natural Gas Corporation) in the nomination blocks during February 2022 was 1581.80 MMSCM, which is 13.11% lower than target for the month and 2.97% lower than the production of February 2021. Cumulative natural gas production by ONGC during April-February, 2021-22 was 18872.98 MMSCM, which is 11.43% and 5.82% lower than target for the period and production during corresponding period of last year respectively. Reasons for shortfall in production are as under:
- Less than anticipated production from WO-16 cluster due to delay in mobilization of MOPU Sagar Samrat.
- Less than planned production from Vasistha /S1 wells in EOA due to certain reservoir related issues.
- Delay in commencement of gas production from U1 field of KG-98/2 Cluster-II due to covid impact as manufacturing of subsea items and well completion got delayed.
- Less production in Tapti-Daman block in B&S Asset due to more than anticipated decline.
- Production decline in Pasarlapudi field & delay of HF in Mandapeta field.
-
- Natural gas production by OIL (Oil India Ltd) in the nomination block during February 2022 was 219.30 MMSCM which is 16.72% higher than production of corresponding month of last year and 2.90% lower than the target for the month of current year. Cumulative natural gas production by OIL during April-February 2021-22 was 2642.04 MMSCM, which is 16.41% higher than production during corresponding period of last year but 2.10% lower than target for the period. Reasons for shortfall in production are as under:
- Less than planned contribution from drilling wells /old wells.
- Less offtake by the consumer (RRVUNL, Rajasthan) due to technical problem, unscheduled shutdown and damaged due to fire.
-
- Natural gas production by Pvt/JVs companies in the PSC/RSC/CBM regime during February 2022 was 801.17 MMSCM, which is 63.82% higher than the production of February 2021 but 24.33% lower than the target for the month. Cumulative natural gas production by Pvt/JVs during April-February, 2021-22 was 9622.24 MMSCM, which is 161.70% higher than production during corresponding period of last year but 9.73% lower than target for the period. Reasons for shortfall in production are as under:
- KG-DWN-98/2 (ONGC): Delay in commissioning of Well U1-A.
- KG-DWN-98/3 (RIL): Production shortfall due to well intervention jobs in some wells.
- RJ-ON-90/1 (Cairn Energy India Ltd): Few Gas wells of RDG field are not producing as per expectations.
- RANIGANJ EAST (Essar Oil and Gas Exploration and Production Ltd.): Shortfall because delay in scheduled operations. Reservoir uncertainties & well bore issues in certain areas of the field.
- RJ-ON//6 (FEL): Production shortfall due to less offtake by customer and natural decline in field.
- Crude Oil Processed (Crude Throughput)
Crude Oil Processed during February 2022 was 20443.03 TMT, which is 0.85% lower than target for the month but 9.81% higher than the February 2021. Cumulative crude processed during April-February 2021-22 was 219366.82 TMT, which is 1.04 and 9.25% higher than target for the period and production during corresponding period of last year respectively. Refinery-wise details of the crude throughput and capacity utilization during the month of February 2022 vis-à-vis February 2021 are given at Annexure-III and Annexure-IV. Company-wise crude throughput for the month of February 2021 and cumulatively for the period April-February 2021-22 vis-à-vis same period of last year has been shown in Table-3 and month-wise in Figure-3.
Table 3: Crude Oil Processed (Crude Throughput) (in TMT)
|
Oil Company |
Target |
February (Month) |
April-February (Cumulative) |
||||||
|
2021-22 (Apr-Mar) |
2021-22 |
2020-21 |
% over last year |
2021-22 |
2020-21 |
% over last year |
|||
|
Target* |
Prod.* |
Prod. |
Target* |
Prod.* |
Prod. |
||||
|
CPSE |
143300.54 |
12979.96 |
12485.47 |
11729.41 |
106.45 |
129045.55 |
124359.71 |
114662.13 |
108.46 |
|
IOCL |
69120.46 |
6134.30 |
5785.13 |
5387.06 |
107.39 |
62325.86 |
61028.56 |
56423.74 |
108.16 |
|
BPCL |
29801.53 |
2571.00 |
2630.13 |
2674.16 |
98.35 |
26951.53 |
27048.16 |
23462.58 |
115.28 |
|
HPCL |
17751.16 |
1747.01 |
1508.95 |
1378.92 |
109.43 |
15817.71 |
12432.38 |
14843.59 |
83.76 |
|
CPCL |
9130.00 |
998.39 |
928.45 |
757.60 |
122.55 |
8131.60 |
7978.34 |
7279.35 |
109.60 |
|
NRL |
2840.00 |
224.00 |
234.05 |
227.10 |
103.06 |
2592.00 |
2436.23 |
2466.45 |
98.77 |
|
MRPL |
14594.35 |
1300.00 |
1392.27 |
1297.36 |
107.32 |
13169.35 |
13366.96 |
10113.16 |
132.17 |
|
ONGC |
63.04 |
5.26 |
6.48 |
7.21 |
89.97 |
57.51 |
69.07 |
73.27 |
94.27 |
|
JVs |
18079.47 |
1365.00 |
1604.32 |
614.84 |
260.93 |
16573.47 |
18640.58 |
14634.45 |
127.37 |
|
BORL |
7058.47 |
520.00 |
594.41 |
601.47 |
98.83 |
6488.47 |
6706.20 |
5587.50 |
120.02 |
|
HMEL |
11021.00 |
845.00 |
1009.92 |
13.37 |
7554.16 |
10085.00 |
11934.38 |
9046.95 |
131.92 |
|
Private |
78008.07 |
6273.16 |
6353.24 |
6273.16 |
101.28 |
71491.35 |
76366.53 |
71491.35 |
106.82 |
|
RIL |
60940.96 |
4876.36 |
4790.09 |
4876.36 |
98.23 |
56051.02 |
57892.32 |
56051.02 |
103.29 |
|
NEL |
17067.11 |
1396.79 |
1563.15 |
1396.79 |
111.91 |
15440.33 |
18474.21 |
15440.34 |
119.65 |
|
TOTAL |
239388.08 |
20618.12 |
20443.03 |
18617.41 |
109.81 |
217110.37 |
219366.82 |
200787.94 |
109.25 |
Note: Totals may not tally due to rounding off. *: Provisional
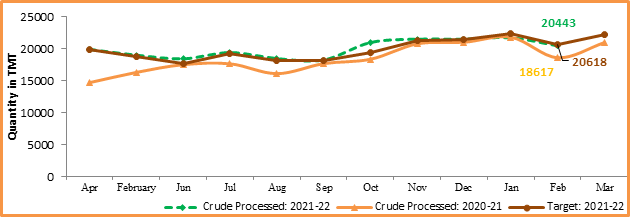
Figure 3: Crude Oil Processed (Crude Throughput)
3.1 CPSE Refineries’ crude oil processed during February 2022 was 12485.47 TMT, which is 3.81% lower than target for the month but 6.45% higher than the production of February 2021. Cumulative crude throughput during April-February 2021-22 was 124359.71 TMT which is 8.46% higher than corresponding period of last year but 3.63% lower than target for the period. Reasons for shortfall in production are as under:
- IOCL-Guwahati, Haldia, Digboi Refinery: Monthly Crude processed in line of products demand.
- IOCL-Bongaigaon Refinery: Monthly Crude processed lower due to total power failure.
- HPCL, Visakh Refinery: Monthly Crude processed lower due to deferment of commissioning of new Crude Distillation Unit (CDU).
3.2 JV refineries’ crude oil processed during February 2022 was 1604.32 TMT, which is 17.53% higher than the target for the month and 160.93% higher than the production of February 2021. Cumulative crude throughput during April-February 2021-22 was 18640.58 TMT, which is 12.47% and 27.37% higher than target for the period and production during corresponding period of last year respectively.
3.3 Private refineries’ crude oil processed during February 2022 was 6353.24 TMT, which is 1.28% higher than the corresponding month of last year. Cumulative crude throughput during April-February 2021-22 was 76366.53 TMT, which is 6.82% higher than the corresponding period of last year.
- Production of Petroleum Products
-
- Production of Petroleum Products during February 2021 was 21151.70 TMT, which is 1.21% higher target for the month and 8.81% higher than the production of February 2021. Cumulative production during April-February, 2021-22 was 230158.29 TMT, which is 1.66% and 9.24% higher than target for the period and production during corresponding period of last year respectively. Unit-wise production of petroleum products is given at Annexure-V. Company-wise production for the month of February 2021-22 and cumulatively for April-February, 2021 vis-à-vis same period of last year has been shown in Table-4 and month-wise in Figure-4.
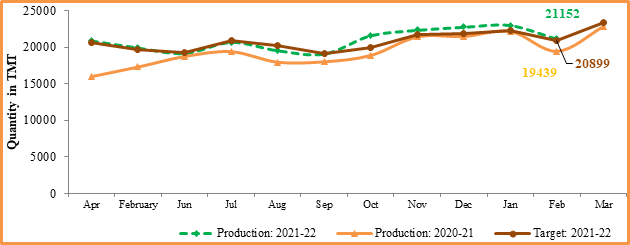
Figure 4: Monthly Refinery Production of Petroleum Products
Table 4: Production of Petroleum Products (TMT)
|
Oil Company |
Target |
February (Month) |
April-February (Cumulative) |
||||||
|
2021-22 (Apr-Mar)* |
2021-22 |
2020-21 |
% over last year |
2021-22 |
2020-21 |
% over last year |
|||
|
Target* |
Prod.* |
Prod. |
Target* |
Prod.* |
Prod. |
||||
|
CPSE |
135423.57 |
11865.29 |
11549.95 |
11115.64 |
103.91 |
122383.61 |
117477.17 |
108596.79 |
108.18 |
|
IOCL |
65757.60 |
5593.87 |
5437.59 |
5134.48 |
105.90 |
59605.10 |
58443.15 |
54183.05 |
107.86 |
|
BPCL |
27811.21 |
2439.92 |
2416.11 |
2545.79 |
94.91 |
25135.95 |
25709.44 |
22381.76 |
114.87 |
|
HPCL |
16583.96 |
1633.88 |
1336.84 |
1316.68 |
101.53 |
14776.58 |
11510.78 |
13897.04 |
82.83 |
|
CPCL |
9279.11 |
781.15 |
876.54 |
717.04 |
122.24 |
8414.27 |
7331.64 |
6672.73 |
109.87 |
|
NRL |
2839.03 |
223.92 |
235.30 |
222.32 |
105.84 |
2591.12 |
2400.38 |
2489.99 |
96.40 |
|
MRPL |
13092.62 |
1187.55 |
1241.45 |
1172.80 |
105.85 |
11805.85 |
12015.95 |
8902.39 |
134.97 |
|
ONGC |
60.02 |
5.00 |
6.12 |
6.53 |
93.79 |
54.75 |
65.83 |
69.82 |
94.29 |
|
JVs |
16813.56 |
1236.16 |
1459.40 |
560.11 |
260.56 |
15397.18 |
17214.06 |
13562.22 |
126.93 |
|
BORL |
6547.56 |
485.16 |
565.49 |
541.06 |
104.52 |
6015.18 |
6007.18 |
4909.48 |
122.36 |
|
HMEL |
10266.00 |
751.00 |
893.92 |
19.05 |
4692.97 |
9382.00 |
11206.87 |
8652.75 |
129.52 |
|
Private |
93222.97 |
7459.64 |
7849.49 |
7459.64 |
105.23 |
84669.54 |
91743.36 |
84669.54 |
108.35 |
|
RIL |
76683.16 |
6100.06 |
6349.35 |
6100.06 |
104.09 |
69702.65 |
73998.58 |
69702.65 |
106.16 |
|
NEL |
16539.81 |
1359.58 |
1500.14 |
1359.58 |
110.34 |
14966.89 |
17744.77 |
14966.90 |
118.56 |
|
Total Refinery |
245460.10 |
20561.09 |
20858.84 |
19135.39 |
109.01 |
222450.33 |
226434.58 |
206828.56 |
109.48 |
|
Fractionators |
4331.28 |
338.15 |
292.86 |
303.64 |
96.45 |
3947.78 |
3723.71 |
3854.59 |
96.60 |
|
TOTAL |
249791.38 |
20899.24 |
21151.70 |
19439.03 |
108.81 |
226398.11 |
230158.29 |
210683.15 |
109.24 |
Note: Totals may not tally due to rounding off. *: Provisional
-
- Production of petroleum Products by Oil’s Refineries during February 2022 was 20858.84 TMT, which is 1.45% higher than target for the month and 9.01% higher than the production of February 2021. Cumulative production during April-February, 2021-22 was 226434.58 TMT, which is 1.79% and 9.48% higher than target for the period and production during corresponding period of last year respectively.
-
- Production of petroleum Products by Fractionators during February 2022 was 292.86 TMT, which is 13.39% lower than the target for the month and 3.55% lower than production of February 2021. Cumulative production during April-February, 2021-22 was 3723.71 TMT, which is 5.68% and 3.40% lower than target for the period and production during corresponding period of last year respectively.
***********
YB/RM

