- Production of Crude Oil
Crude oil production during June 2022 was 2439.32 TMT, which is 3.01% lower than target for the month and 1.71% lower than the production of June 2021. Cumulative crude oil production during April-June, 2022 was 7459.22 TMT, which is 1% lower than target for the period but 0.62% higher than production during corresponding period of last year respectively. Unit-wise and State-wise crude oil production is given at Annexure-I. Unit-wise crude oil production for the month of June 2022 and cumulatively for April-June 2021-22 vis-à-vis same period of last year has been shown in Table-1 and month-wise in Figure-1.
Table-1: Crude Oil Production (in TMT)
|
Oil Company |
Target |
June (Month) |
April-June (Cumulative) |
||||||
|
2022-23 (Apr-Mar)* |
2022-23 |
2021-22 |
% over last year |
2022-23 |
2021-22 |
% over last year |
|||
|
Target* |
Prod.* |
Prod. |
Target* |
Prod.* |
Prod. |
||||
|
ONGC (Nomination Block) |
19869.61 |
1643.50 |
1625.29 |
1621.92 |
100.21 |
4987.83 |
4969.63 |
4812.14 |
103.27 |
|
OIL (Nomination Block) |
3571.00 |
274.72 |
257.17 |
246.52 |
104.32 |
804.49 |
773.85 |
742.34 |
104.24 |
|
Pvt/JVs (PSC/RSC Regime) |
7400.88 |
596.69 |
556.86 |
613.32 |
90.79 |
1742.47 |
1715.74 |
1858.52 |
92.32 |
|
Total |
30841.49 |
2514.92 |
2439.32 |
2481.75 |
98.29 |
7534.79 |
7459.22 |
7413.00 |
100.62 |
- Note: Totals may not tally due to rounding off. *: Provisional
Figure-1: Monthly Crude Oil Production

Unit-wise production details with reasons for shortfall are as under:
- Crude oil production by ONGC (Oil and Natural Gas Corporation) in nomination block during June 2022 was 1625.29 TMT, which is 1.11% lower than target of the month and 0.21% higher when compared with production of June 2021. Cumulative crude oil production by ONGC during April-June, 2022 was 4969.63 TMT, which is 0.36% lower than target for the period but 3.27% higher than target for the period and production during corresponding period of last year respectively. Production is mainly lower due to lower condensate generation in Bassein and Tapti Daman area.
- Crude oil production by OIL (Oil India Ltd) in the nomination block during June 2022 was 257.17 TMT, which is 6.39% lower than the target of the month but 4.32% higher when compared with production of June, 2021. Cumulative crude oil production by OIL during April-June 2022 was 773.85 TMT, which is 3.81% lower than target for the period but 4.24% higher when compared production during corresponding period of last year. Reasons for shortfall in production are as under:
- Less than planned contribution from workover wells.
- Loss due to miscreant activities in Main Producing Area (MPA).
- Crude oil production by Pvt/JVs companies in the PSC/RSC regime during June 2022 was 556.86 TMT, which is 6.68% lower than the target of the reporting month and 9.21% lower than the month production of June 2021. Cumulative crude oil production by Pvt/JVs companies during April-June 2022 was 1715.74 TMT, which is 1.53% and 7.68% lower than target for the period and production during corresponding period of last year respectively. Reasons for shortfall in production are as under:
- CB-OS/2 (VEDANTA): Shortfall due to delay in Drilling campaign.
- MB/OSDSF/B80/2016 (HOEC) Production shortfall due to D1 well is shut-in due to operational issues and Plant shut-down multiple times due to process shut-down.
- RAVVA (VEEDANTA): Production shortfall due to RE wells were shut for rig move activities, leading to reduced monthly realization and Increased water cut in RE-5
- RJ-ON-90/1 (VEDANTA): Production shortfall due to Few well failures in ABH & NL; Well failures and higher injection losses to de risk infill drilling in Bhagyam. Some well shut-in due to SRP pump issues in Guda, Kaameshwari West, Raaggeshwari Oil.
- CB-ONN-2000/1 (GSPC): Few wells not producing due to possible casing damage, snapped/unscrewed sucker rod string.
- Production of Natural Gas
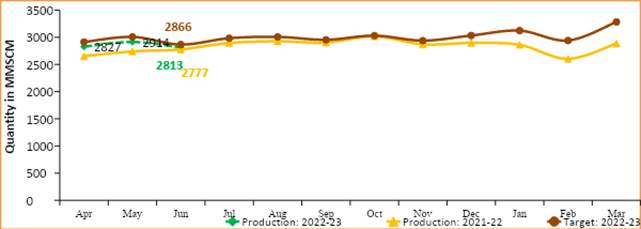
Natural gas production during June 2022 was 2812.78 MMSCM, which is 1.85% lower than the monthly target but 1.29% higher than production of June 2021. Cumulative natural gas production during April-June 2022 was 8553.16 MMSCM, which is 2.63% lower when compared with target for the period but 4.71% higher than production during corresponding period of last year. Unit-wise and state-wise natural gas production is given at Annexure-II. Unit-wise natural gas production for the month of June 2022 and cumulatively for April-June 2021-22 vis-à-vis same period of last year has been shown in Table-2 and month-wise in Figure-2.
Table-2: Natural Gas Production (in MMSCM)
|
Oil Company |
Target |
June (Month) |
April-June (Cumulative) |
||||||
|
2022-23 (Apr-Mar)* |
2022-23 |
2021-22 |
% over last year |
2022-23 |
2021-22 |
% over last year |
|||
|
Target* |
Prod.* |
Prod. |
Target* |
Prod.* |
Prod. |
||||
|
ONGC (Nomination Block) |
20381.94 |
1627.43 |
1637.24 |
1684.40 |
97.20 |
5076.75 |
5086.56 |
5051.93 |
100.69 |
|
OIL (Nomination Block) |
3717.84 |
305.55 |
246.75 |
230.14 |
107.22 |
924.79 |
742.78 |
675.20 |
110.01 |
|
Pvt/JVs (PSC/RSC Regime) |
11968.32 |
932.86 |
928.80 |
862.44 |
107.69 |
2782.31 |
2723.82 |
2441.02 |
111.59 |
|
Total |
36068.10 |
2865.83 |
2812.78 |
2776.98 |
101.29 |
8783.85 |
8553.16 |
8168.15 |
104.71 |
Note: Totals may not tally due to rounding off. *: Provisional
Figure-2: Monthly Natural Gas Production

- Natural gas production by ONGC (Oil and Natural Gas Corporation) in the nomination blocks during June 2022 was 1637.24 MMSCM, which is 0.6% higher target for the month but 2.8% lower than the production of June 2021. Cumulative natural gas production by ONGC during April-June, 2022 was 5086.56 MMSCM, which is 0.19% and 0.69% higher than target for the period and production during corresponding period of last year respectively.
- Less Free gas production in MH field and normalization of gas throughput towards Uran after hook up jobs for new slug catcher, leading to less sweet gas towards Hazira side.
- Delay in HF in Mandapeta & Natural Decline in Psarlapudi and Kesanapalli-W fields in Rajahmundry.
- Potential decline and ceasure of wells in Gandhar field in Ankleshwar Asset.
- S/D of OTPC unit#2 for Annual Maintenance since 23.05.2022 in Tripura.
- Decline in AG in Geleki field & FG in Laiplingaon field in Assam Asset.
- Natural gas production by OIL (Oil India Ltd) in the nomination block during June 2022 was 246.75 MMSCM which is 19.24% lower than the target for the month of current year but 7.22% higher than production of corresponding month of last year. Cumulative natural gas production by OIL during April-June 2022 was 742.78 MMSCM, which is 19.68% lower than target for the period but 10.01% higher than production during corresponding period of last year. Reasons for shortfall in production are as under:
- Low upliftment/demand of gas by the major customers.
- Less than planned contribution from drilling wells and old wells.
- Natural gas production by Pvt/JVs companies in the PSC/RSC/CBM regime during June 2022 was 928.80 MMSCM, which is 0.43% lower than the target for the month but 7.69% higher when compared the production of June 2021. Cumulative natural gas production by Pvt/JVs during April-June, 2022 was 2723.82 MMSCM, which is 2.1% lower than target for the period but 11.59% higher than production during corresponding period of last year. Reasons for shortfall in production are as under:
- AAP-ON-94/1 (HOEC): Production Shortfall due to Low consumer demand.
- CB-OS/2 (VEDANTA): Shortfall due to delay in Drilling campaign.
- MB/OSDSF/B80/2016 (HOEC) Production shortfall due to D1 well is shut-in due to operational issues and Plant shut-down multiple times due to process shut-down.
- RJ-ON/6 (FEL): Less offtake of gas by buyer for two days and natural decline from wells.
- RAVVA (VEEDANTA): Production shortfall due to RE wells were shut for rig move activities, leading to reduced monthly realization and Increased water cut in RE-5
- Crude Oil Processed (Crude Throughput)
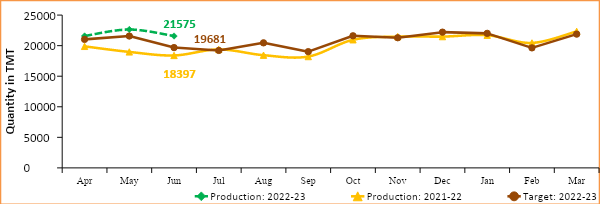
Crude Oil Processed during June 2022 was 21574.57 TMT, which is 9.62% higher than target for the month and 17.27% higher than the June 2021. Cumulative crude processed during April-June 2022 was 65798.09 TMT, which is 5.64% and 14.92% higher than target for the period and production during corresponding period of last year respectively. Refinery-wise details of the crude throughput and capacity utilization during the month of June 2022 vis-à-vis June 2021 are given at Annexure-III and Annexure-IV. Company-wise crude throughput for the month of June 2021 and cumulatively for the period April-June 2022 vis-à-vis same period of last year has been shown in Table-3 and month-wise in Figure-3.
Figure 3: Crude Oil Processed (Crude Throughput)

Table 3: Crude Oil Processed (Crude Throughput) (in TMT)
|
Oil Company |
Target |
June (Month) |
April-June (Cumulative) |
||||||
|
2022-23 (Apr-Mar)* |
2022-23 |
2021-22 |
% over last year |
2022-23 |
2021-22 |
% over last year |
|||
|
Target* |
Prod.* |
Prod. |
Target* |
Prod.* |
Prod. |
||||
|
CPSE |
154983.78 |
11870.45 |
13454.57 |
10464.97 |
128.57 |
38679.02 |
41319.46 |
33301.10 |
124.08 |
|
IOCL |
69999.90 |
5874.97 |
6276.80 |
5358.33 |
117.14 |
18092.31 |
18936.47 |
16721.43 |
113.25 |
|
BPCL |
37000.00 |
2695.00 |
2895.38 |
2467.58 |
117.34 |
9375.00 |
9559.88 |
8306.96 |
115.08 |
|
HPCL |
18920.85 |
1258.50 |
1633.54 |
785.28 |
208.02 |
4250.10 |
4809.55 |
2508.01 |
191.77 |
|
CPCL |
10300.00 |
600.00 |
972.61 |
645.55 |
150.66 |
2430.00 |
2882.25 |
2034.51 |
141.67 |
|
NRL |
2800.00 |
236.62 |
240.56 |
192.73 |
124.82 |
717.75 |
786.62 |
640.03 |
122.90 |
|
MRPL |
15900.00 |
1200.00 |
1428.97 |
1009.62 |
141.53 |
3800.00 |
4325.14 |
3070.48 |
140.86 |
|
ONGC |
63.04 |
5.36 |
6.72 |
5.88 |
114.40 |
13.87 |
19.55 |
19.70 |
99.27 |
|
Pvt/JVs |
94637.83 |
7810.72 |
8120.00 |
7932.04 |
102.37 |
23604.03 |
24478.63 |
23954.75 |
102.19 |
|
HMEL |
11451.93 |
941.61 |
1078.48 |
1062.92 |
101.46 |
2873.50 |
3229.52 |
3224.22 |
100.16 |
|
RIL |
63021.49 |
5219.35 |
5361.90 |
5219.35 |
102.73 |
15755.52 |
16184.00 |
15755.52 |
102.72 |
|
NEL |
20164.41 |
1649.76 |
1679.62 |
1649.76 |
101.80947 |
4975.01 |
5065.11 |
4975.01 |
101.8111 |
|
TOTAL |
249621.61 |
19681.17 |
21574.57 |
18397.01 |
117.27 |
62283.06 |
65798.09 |
57255.85 |
114.92 |
Note.Totals may not tally due to rounding off. *: Provisional
3.1 CPSE Refineries’ crude oil processed during June 2022 was 13454.57 TMT, which is 13.35% higher than target for the month and 28.57% higher than the production of June 2021. Cumulative crude throughput during April-June 2022 was 41319.46 TMT which is 6.83% and 24.08% higher than target for the period and production during corresponding period of last year respectively. Reasons for shortfall in production are as under:
- IOCL-Panipat Refinery: Crude processed lower due to high TAN crude processing.
- IOCL-Paradip Refinery: Crude processed lower due to GY tripping and INDMAX unit shutdown.
- HPCL-Visakh: Crude processed lower due to shutdown of a primary unit.
3.2 Private & JVs Refineries’ crude oil processed during June 2022 was 8120.0 TMT, which is 3.96% higher than the target for the month and 2.37% higher than the production of June 2021. Cumulative crude throughput during April-June 2022 was 24478.63 TMT, which is 3.71% and 2.19% higher than target for the period and production during corresponding period of last year respectively.
- Production of Petroleum Products
- Production of Petroleum Products during June 2021 was 22059.08 TMT, which is 9.27% higher target for the month and 15.08% higher than the production of June 2021. Cumulative production during April-June, 2022 was 68120.47 TMT, which is 6.27% and 13.55% higher than target for the period and production during corresponding period of last year respectively. Unit-wise production of petroleum products is given at Annexure-V. Company-wise production for the month of June 2022 and cumulatively for April-June, 2022 vis-à-vis same period of last year has been shown in Table-4 and month-wise in Figure-4.
Table 4: Production of Petroleum Products (TMT)
|
Oil Company |
Target |
June (Month) |
April-June (Cumulative) |
||||||
|
2022-23 (Apr-Mar)* |
2022-23 |
2021-22 |
% over last year |
2022-23 |
2021-22 |
% over last year |
|||
|
Target* |
Prod.* |
Prod. |
Target* |
Prod.* |
Prod. |
||||
|
CPSE |
144648.94 |
11031.97 |
12617.72 |
9771.63 |
129.13 |
36064.82 |
38793.80 |
31396.40 |
123.56 |
|
IOCL |
66322.30 |
5533.40 |
5959.39 |
5016.78 |
118.79 |
17148.15 |
18011.12 |
15964.32 |
112.82 |
|
BPCL |
34005.99 |
2463.83 |
2729.21 |
2323.75 |
117.45 |
8614.16 |
9015.59 |
7901.48 |
114.10 |
|
HPCL |
17495.57 |
1141.73 |
1455.73 |
793.33 |
183.50 |
3875.58 |
4412.01 |
2413.42 |
182.81 |
|
CPCL |
9614.24 |
561.39 |
970.88 |
569.50 |
170.48 |
2269.27 |
2704.00 |
1789.08 |
151.14 |
|
NRL |
2748.86 |
232.30 |
256.97 |
159.72 |
160.89 |
704.64 |
807.19 |
604.60 |
133.51 |
|
MRPL |
14401.95 |
1094.22 |
1238.97 |
902.84 |
137.23 |
3439.81 |
3824.99 |
2704.78 |
141.42 |
|
ONGC |
60.02 |
5.10 |
6.57 |
5.71 |
115.15 |
13.20 |
18.91 |
18.72 |
101.01 |
|
Pvt/JVs |
111404.56 |
8840.47 |
9112.28 |
9075.45 |
100.41 |
27130.27 |
28412.93 |
27574.68 |
103.04 |
|
HMEL |
10528.86 |
800.18 |
1043.03 |
1035.16 |
100.76 |
2617.31 |
3054.71 |
3061.71 |
99.77 |
|
RIL |
81492.18 |
6427.27 |
6488.83 |
6427.27 |
100.96 |
19718.00 |
20556.02 |
19718.00 |
104.25 |
|
NEL |
19383.52 |
1613.02 |
1580.42 |
1613.02 |
97.98 |
4794.97 |
4802.20 |
4794.97 |
100.15 |
|
Total Refinery |
256053.50 |
19872.43 |
21730.00 |
18847.07 |
115.30 |
63195.09 |
67206.73 |
58971.08 |
113.97 |
|
Fractionators |
3888.14 |
316.10 |
329.09 |
322.11 |
102.16 |
903.74 |
913.75 |
1021.66 |
89.44 |
|
TOTAL |
259941.64 |
20188.53 |
22059.08 |
19169.19 |
115.08 |
64098.83 |
68120.47 |
59992.74 |
113.55 |
Note: Totals may not tally due to rounding off. *: Provisional
Figure 4: Monthly Refinery Production of Petroleum Products

- Production of petroleum Products by Oil’s Refineries during June 2022 was 21730.0 TMT, which is 9.35% higher than target for the month and 15.3% higher than the production of June 2021. Cumulative production during April-June, 2022 was 67206.73 TMT, which is 6.35% and 13.97% higher than target for the period and production during corresponding period of last year respectively.
- Production of petroleum Products by Fractionators during June 2022 was 329.09 TMT, which is 4.11% higher than the target for the month and 2.16% higher than production of June 2021. Cumulative production during April-June, 2022 was 913.75 TMT, which is 1.11% higher than target for the period but 10.56% lower than production during corresponding period of last year respectively.
Click here to see Annexure-III
********
YB/RM

